
| |
Manual |
This utlity was developed to perform single-value decomposition (SVD; e.g., Williamson et al., Biophys J. 94, 4906-4923, 2008) on a set of I(q) vs. q data, which can come from a HPLC-SAXS experiment, or from any other SAS type of data, like a concentration series.
A single SAS experimental dataset is typically represented as I(q), where q is a grid of points. A sequence of n I(q)t(j) on the same q-grid can be assembled into a m × n matrix I = [Iij] = [I(q)t(1), I(q)t(2), ..., I(q)t(n)]. Each column of I contains an I(q) curve for a specific t and each row contains an I(t) curve for a specific q. If standard deviations of the experimental data are available, these can be analogously placed in a matrix S. If a synchronized concentration dataset C(t) is available, it can be added to I as an additional row.
In a SVD analysis, if I is the matrix containing the original data, then:
I = USVT
where U is an orthogonal m × m matrix, S is a diagonal m × n matrix, and VT is an orthogonal n × n matrix. The elements of the diagonal of S are the singular values. Reconstructing an approximation of the matrix I proceeds by setting some diagonal elements of S to zero, forming S' and performing the multiplication
I' = US'VT
SVD can be performed either on the original or on the baseline-subtracted I(q) vs. q data or subset of data (if significant baseline drift occurs, the SVD will try to fit also that part of the signal).
After selecting the data, pressing the SVD button in the HPLC-SAXS module will open a new window:
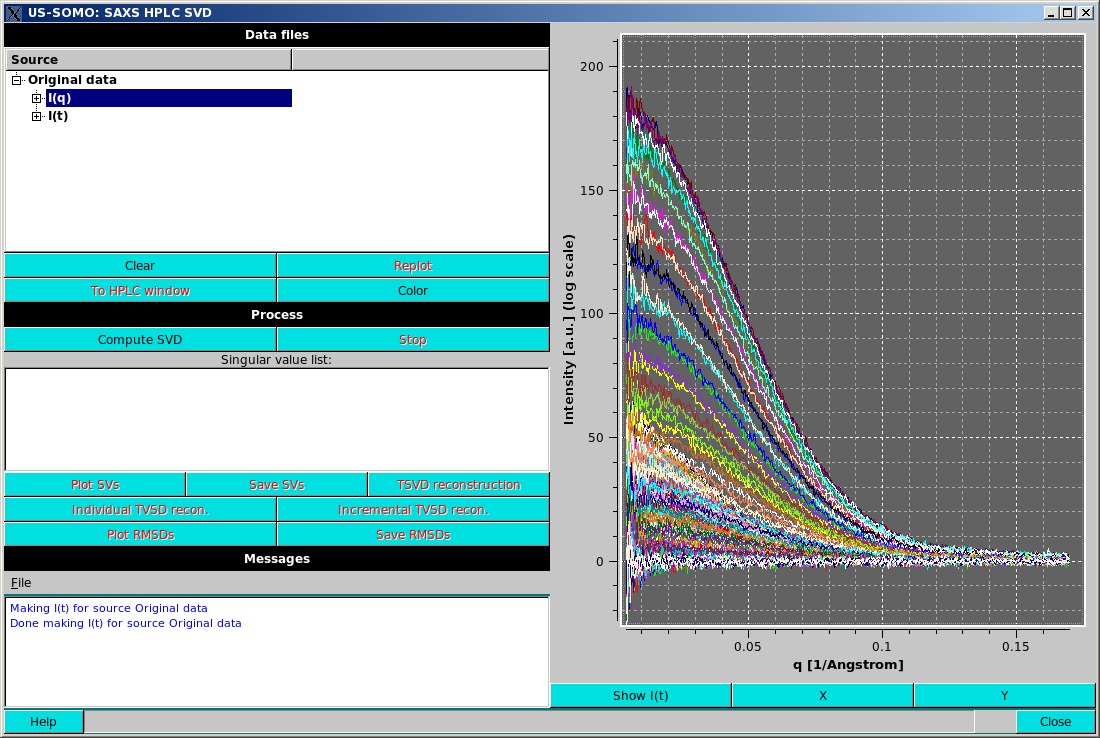
The top left box labelled Data files will contain a list of the data set in an expandable format. The first set will be labelled "Original data". Opening the item will show its contents, "I(q)" and "I(t)", which can be further expanded to show/select the individual curves in the data set.
Replot will become active when a selection is changed from what is currently plotted; pressing it will refresh the plot display. For example, selecting "Original data" at the top level and pressing Replot will plot the entire dataset, but only in the "I(q)" or "I(t)" mode.
TO HPLC window will transfer the selected dataset back to the HPLC-SAXS module main window.
Show I(t) or Show I(q) toggle button below the plot window will show the I(t) vs. t or I(q) vs. q view of the data and automatically replot.
Color will rotate the plot colors based upon a pre-defined palette.
When a single data set or sub-selection of individual I(q) curves from a single dataset are selected and the plot window is in "I(q)" mode, the Compute SVD button in the Process box becomes active.
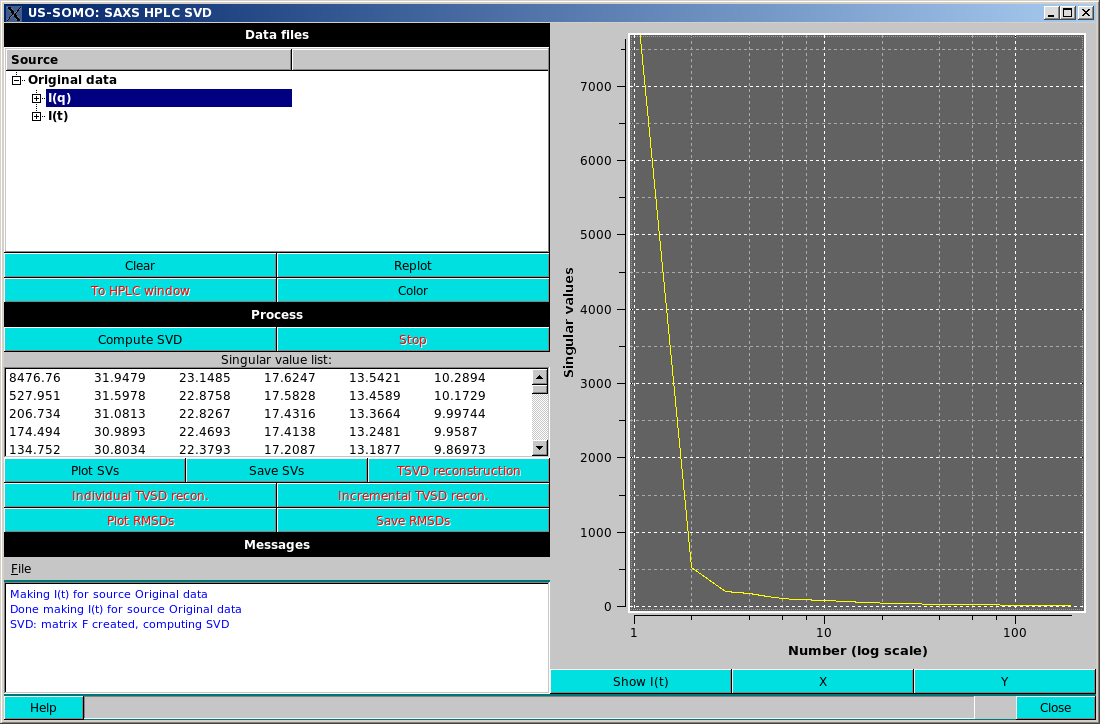
Pressing Compute SVD will compute the singular value decomposition (Lawson & Hanson, Solving least squares problems. SIAM, Philadelphia, 1995). The singular values (SVs) will be sorted in descending order and placed on the screen in the Singular value list window.
Plot SVs will plot the SVs in the plot area, by default in a linear vs. log scale (see above).
The axes scales can be toggled between logarithmic and linear by pressing the X or Y buttons below the plot window.
Save SVs will save the SVs to a file. Giving the filename a ".csv" extension will result in a comma separated output, otherwise, the output will be "TAB" separated.
Selecting any set of SVs in the Singular value list by clicking on it will activate three more buttons: TSVD reconstruction, Individual TSVD recon., and Incremental TSVD recon..
TSVD reconstruction will generate a new dataset in the Data files section consisting of the reconstruction of the data based upon the selected SVs. "TSVD" means a truncated SVD reconstruction (Aster et al., Parameter Estimation and Inverse Problems. Elsevier Academic Press, 2005), which formally should be computed on the numerically highest SVs, but here we are using the term loosely, to mean reconstruction on any subset of the SVs. The resulting dataset can be selected, expanded and/or plotted identically to the original data. Expanding the TSVD data will show "I(q)", "I(t)", "SVs used" expandable subsections and also the root mean squared deviation over the number of points (RMSD) of the expansion and the name of the reference dataset for the reconstruction.
Individual TSVD recon. will take the selected SVs and produce a TSVD reconstruction for each value selected individually, resulting in multiple TSVD reconstructions in the Data files section.
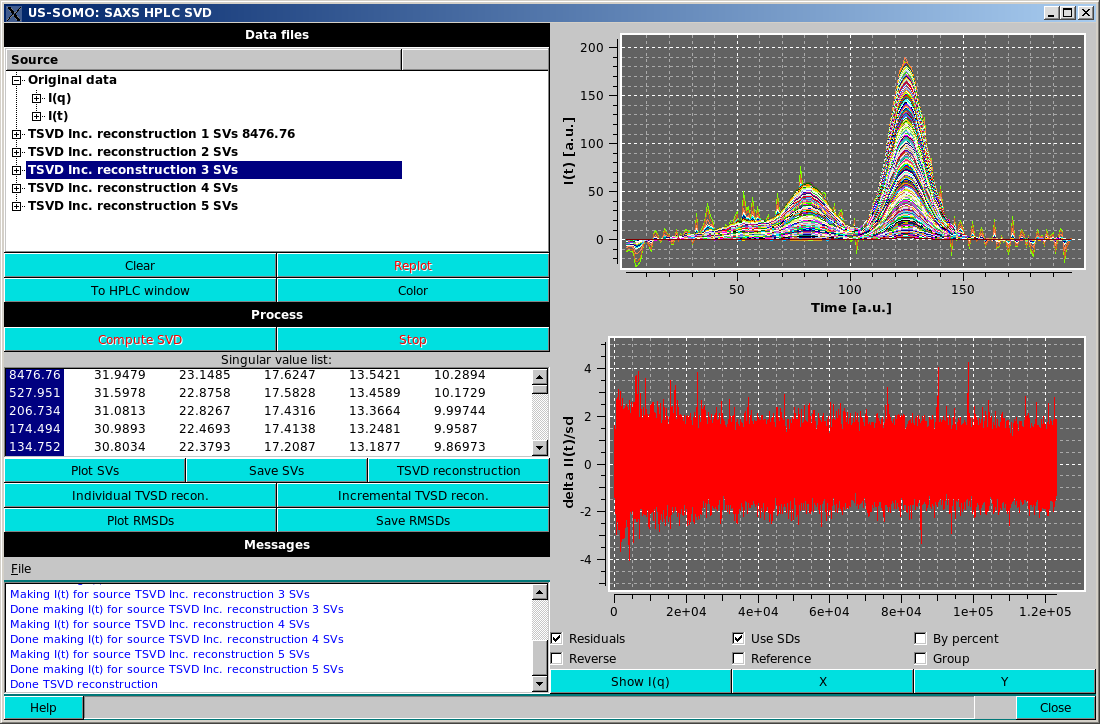
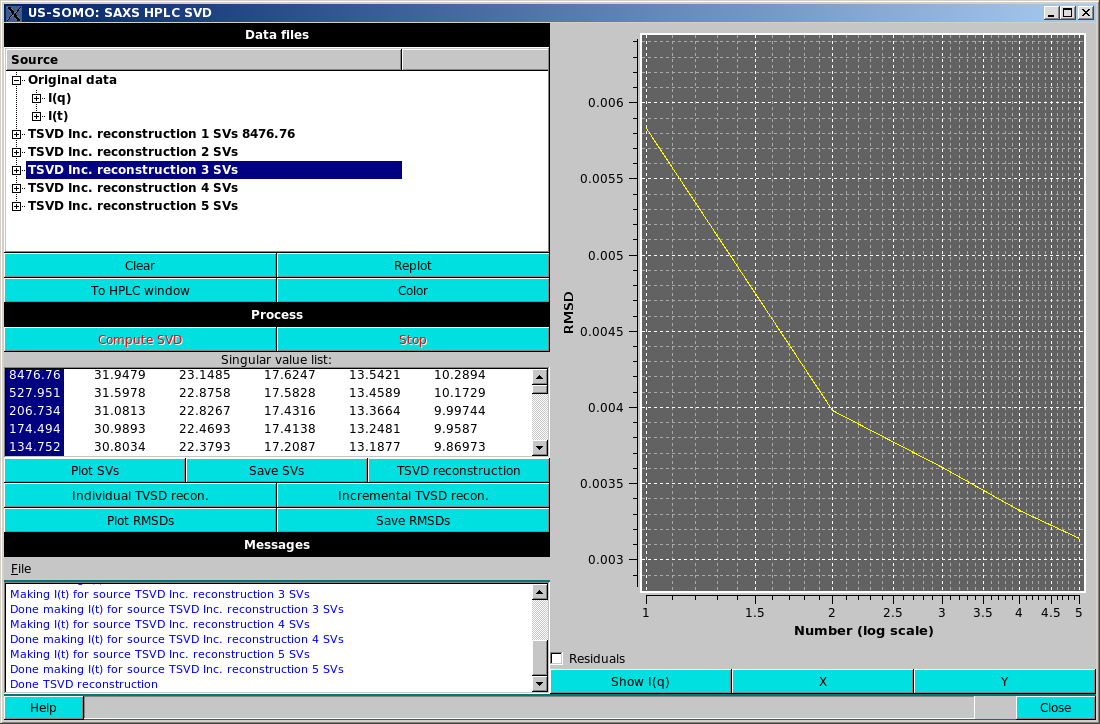
Incremental TSVD recon. will take the selected singular values and produce a TSVD reconstruction for the first value selected, then for the first and second values selected, etc., until all the selected values are included in a reconstruction, again resulting in multiple reconstructions in the Data files section, as in the example shown above. Note that the display has been swithced to the "I(t)" mode, where the goodness of the reconstruction can be better appreciated than in the "I(q)" mode.
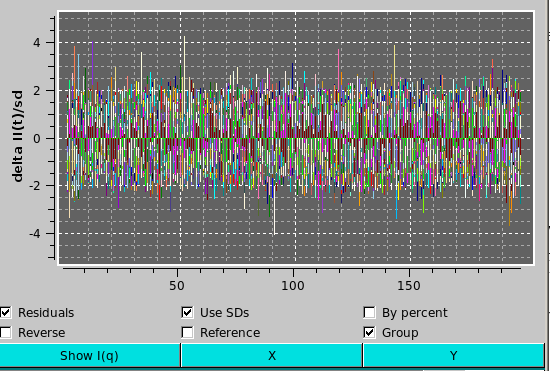
When Individual TSVD recon. or Incremental TSVD recon. are selected, the residuals checkbox under the plot appears. Selecting this checkbox will plot the residuals of the reconstruction vs. the reference dataset in a new plot area below the main plot area. When residuals are displayed, additional checkboxes will be available under the plot. These include:
Once an individual or incremental reconstruction is computed, two more buttons activate:
Plot RMSDs and Save RMSDs, allowing plotting and saving analogous to the Plot SVs and Save SVs mentioned previously.
As mentioned above, any reconstructed dataset can then be added to the US-SOMO/HPLC-SAXS module by selecting and pressing the To HPLC window button. Note only the "I(q)" or "I(t)" data will be added depending on the plot mode.
As an example, suppose one wants to determine the number of components present in a set of I(q) vs. q curves. After bringing them into the SVD module as described above, the SVD can be then computed. By looking at the SVs plot, one can evaluate that at most N singular values seem reasonable to reconstruct the dataset. One would then select the numerically largest N values in the SV list and run an incremental reconstruction. Subsequently, each reconstructed dataset could be compared by RMSD and visually to determine the effect of adding additional singular values to the reconstruction to assist the determination of the minimum number of singular values required to accurately reconstruct the original data. Another check would be to run the individual reconstruction on the same set of selected singular values and inspecting the individual datasets visually (preferable via I(t) plots) to see if there seems to be signal present in reconstructions past a minimum number of singular values. In this way, the US-SOMO/HPLC/SVD module can be used to approximate the number of independent components present in a HPLC experimental dataset or even a concentration series.
This document is part of the UltraScan Software Documentation
distribution.
Copyright © notice.
The latest version of this document can always be found at:
Last modified on April 18, 2016.