
| |
Manual |
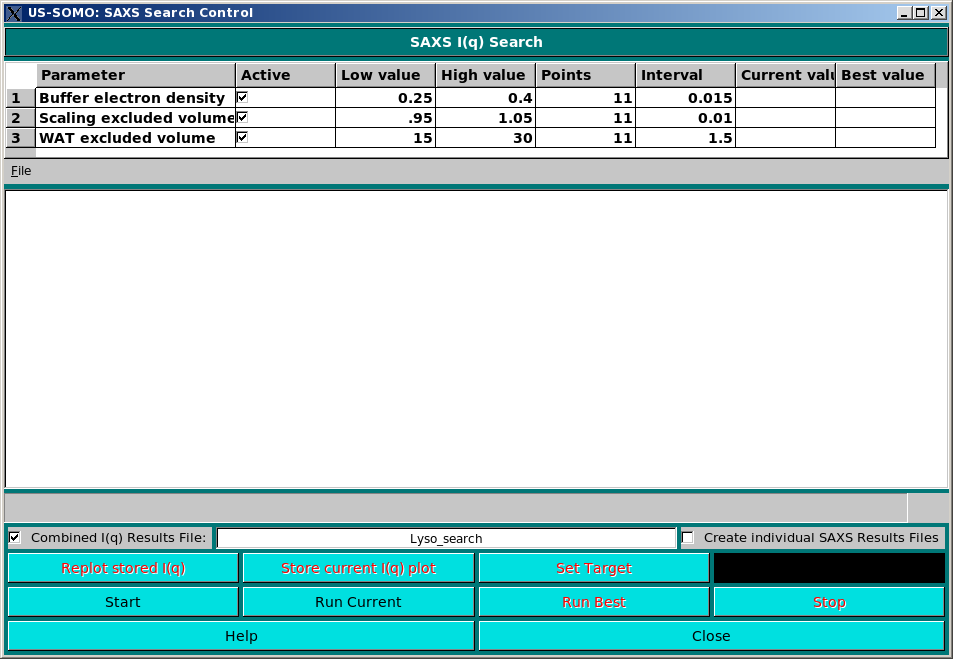
This module is used to set the low- and high-limits for (currently) three parameters that can be varied in the computations of an I(q) vs. q curve, searching for the best combination that will lead to a better match with an experimental curve. It is not meant for routine search when comparing models with experimental data. Rather, it is a tool for studying which changes in the estblished values of the parameters will lead to better matching using well-characterized test proteins. The three parameters are:
The parameters that will be varied during a search are selected by ticking the corresponding checkbox in the Active column. The starting and ending values for the search ae entered under the Low value and High value fields, respectively. The Points and Interval fields are correlated entries that allow to set the stepsize of the search. Given a low- and a high-value, entering the number of points will set the interval, and vice-versa. The last two fields, Current value and Best value will be constantly updated during a search.
The resulting I(q) vs. q curves can be stored in a single csv file by selecting the Combined I(q) Results File: checkbox, and entering a filename in the field to its right. Each I(q) vs. q curve can also be saved in a separate file by selecting the Create Individual SAXS Results Files checkbox.
The experimental target curve can be chosen by clicking on the Set Target button.
Upon entering the Screen utility the then-current I(q) plot curves from the US-SOMO SAXS/SANS window are stored in the Screen window. The stored curves can be used for search targets.
The Replot stored I(q) clears the US-SOMO SAXS/SANS I(q) plot and displays the stored curves.
The Store current I(q) plot stores the current I(q) plot, enabling newly loaded or computed I(q) curves to become search targets.
The search can be activated from the US-SOMO batch module, or it can be started within this module by pressing the Start button, and it can be stopped at any time by pressing the Stop button.
The Run current will and Run Best buttons will run a curve for one set of values, in particular those specified in the Current value or Best value columns and are marked as Active
During a run, the progress window will be continuosly updated with the advancement of the search, reporting also the goodness of the fit to the target curve for each combination of parameters. Be aware that the number of computed I(q) vs. q curves is the product of the number of points set in the Points field for each active parameter! In the example above, 1331 I(q) vs. q curves will be generated.
This document is part of the UltraScan Software Documentation
distribution.
Copyright © notice.
The latest version of this document can always be found at:
Last modified on November 15, 2013.