
| |
Manual |
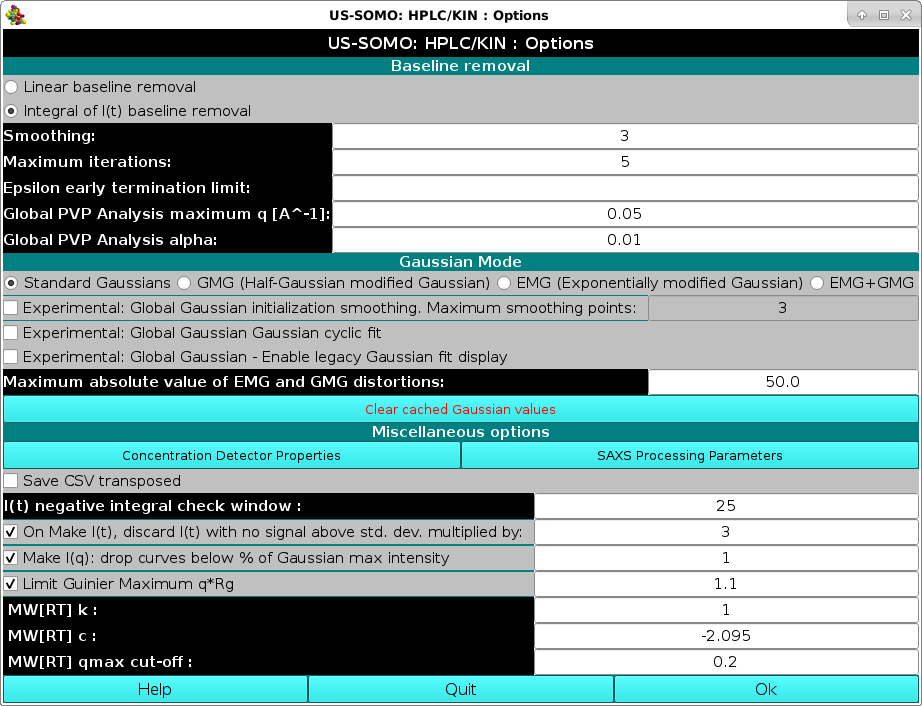
The first set of options deals with baseline removal tools. By default, the US-SOMO HPLC-SAXS module will utilize an Integral of I(t) baseline removal tool.
The method is based upon the assumption that capillary fouling deposits are formed in proportion to the sample intensity while exposed to the beam (and that the buffer is not responsible).
We have developed a mathematical model of this condition and implemented it as the integral baseline procedure.
 |
This is an iterative procedure and the number of steps can be set in the Maximum iterations: field (default: 5 iterations). The program will generate a baseline at each iterative step, which will be showed when testing the results.
As part of this procedure, the epsilon value corresponds to the intensity fouling deposits constant and an early termination criteria can be defined here which will stop the iterative procedure when the difference in epsilon between iterations is less than or equal to the epsilon early termination limit field (default: none).
The Smoothing field controls the size of a Gaussian smoothing kernel of 2n+1 points (default: n=3) that will be applied to each I(t) chromatogram prior to Integral Baseline computation, to avoid large oscillations especially at low q values which might cause problems. The Integral Baseline is nevertheless applied to the original I(t) chromatograms, not to the smoothed data!
The Global PVP Analysis maximum q [A^-1] field defines the upper q value limit (default: 0.05 Å-1) for the CorMap-based P-value pair analysis of datasets (see here).
For special needs or very minor baseline correction requirements, the original linear baseline implementation (Brookes et al., J. App. Cryst. 46:1823-1833, 2013) is available by selecting the Linear baseline removal checkbox. A description of the linear baseline removal tool can be found here)
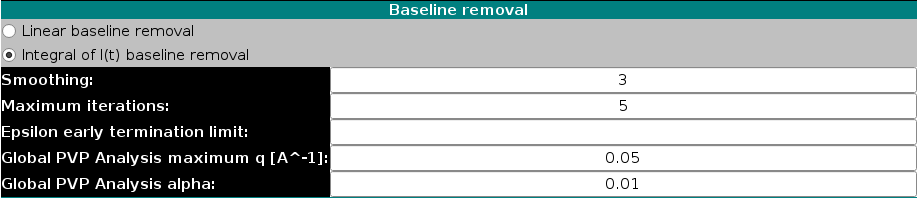
The next set of options deals with the Gaussian mode:
 |
Four alternative round checkboxes are available in the first line:

where a0, a1, a2, and a3 are the area, center, width, and distorsion, respectively, of the half-Gaussian modified Gaussian(s).

where a0, a1, a2, and a3 are the area, center, width, and distorsion, respectively, of the exponentially modified Gaussian(s).

where a0, a1, a2, a3, and a4 are the area, center, width, distorsion 1, and distorsion 2, respectively, of the exponentially + half-Gaussian modified Gaussian(s).
Three other checkboxes are then presented, labeled as "Experimental" as of July 2024, pending their full validation in a publication (Brookes and Rocco, manuscript in preparation):
The Clear cached Gaussian values button allows to clear all Gaussian data produced during the current session.
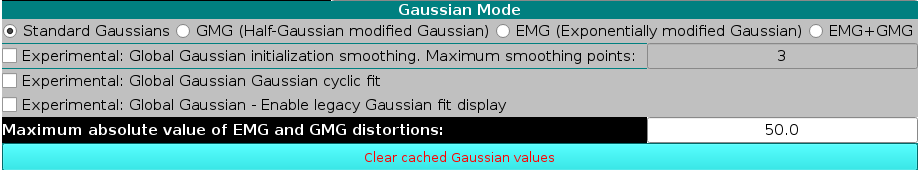
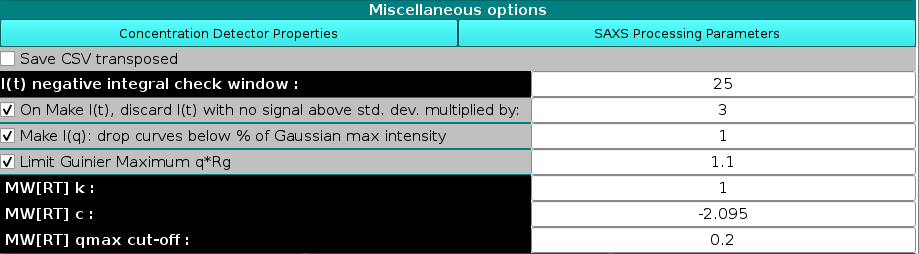
The final section of this module presents a set of Miscellaneous Options:
 |
The first button on the left-side, Concentration Detector Properties, will lead to another pop-up panel:
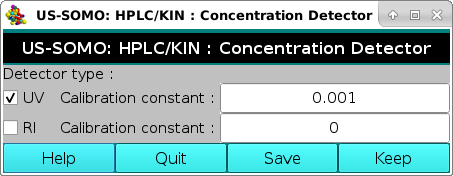 |
where you can choose between two mutually exclusive options which concentration detector is utilized sequentially (or in parallel) in your chromatographic system. This sub-module is fully described here.
The button on the right-side, SAXS Processing Parameters, will also open another pop-up panel:
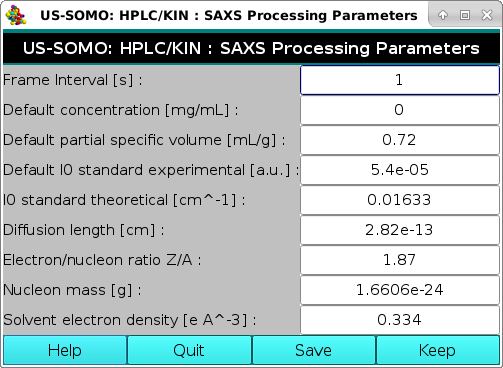 |
This sub-module was created to provide the necessary parameters for converting "raw""I(q) data to an absolute scale. A first absolute scale for the intensity is in [g2/(cm3*mol)], that we identify with the symbol "I#(q)". By dividing I#(q) data by the concentration of the sample in mg/mL, one obtains the data in the absolute scale of [g/mol], which we previously identified with the symbol "I*(q)". These operations utilize the parameters listed in this module, which is fully described here.
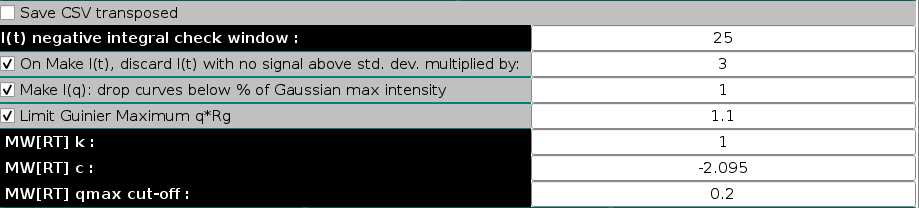 |
Below those two buttons there is the option of saving the *.csv files produced in the HPLC/KIN module in transposed format, by selecting the Save CSV transposed checkbox. Default: unchecked.
It is followed by the I(t) negative integral check window field, where the sliding window size for the negative integral test can be set (default: 25). As described previously, this is the size of a sliding window over adjacent frames. If the sum of I(t) values within the window is less than the negative of sum of the corresponding SD values, the I(t) curve will be identified and a warning will be issued. Such regions can be indicative of not optimal buffer subtraction, and might cause problems with the integral baseline correction.
The next line contains the checkbox for the On Make I(t), discard I(t) with no signal above std. dev. multiplied by: and its associated field (default: checked with 3 as the multiplier value). This tests whether or not there is any point in the I(t) curve where the I(t) value is greater than the SD of the point of I(t) multiplied by the value in this field. If the test fails, the I(t) curve is assumed to contain no signal and is dropped. A Warning message appears in an appropriate pop-up message box listing the first 20 occurences and how many more were found.
Make I(q): drop curves below % of Gaussian max intensity. When recreating I(q) vs. q using Gaussians, they will be generated for all times for all Gaussians. This option will cut-off the tails of each decomposed peak where the signal is already near baseline values, based on a percent value in respect to the maximum intensity of each peak, to avoid generating meaningless extra I(q) vs. q data. Default: 1%.
The Limit Guinier Maximum q*Rg allows to set this limit to a specified value when performing the linear regression in the Guinier analysis to calculate the Rg and I(0) from the I(q) vs q datasets in the Test I(q) module (see the corresponding section in the HPLC/KIN main Help page). Default: checked with 1.1 as the limiting product.
Finally, the last three fields allow modifying the constants for the approximate calculation of the molecular weight as described by Rambo and Tainer (Accurate assessment of mass, models and resolution by small-angle scattering. Nature 496:477-481, 2013). The first two fields contain the constants MW[RT]k (default: 1) and MW[RT]c (default: -2.095), which are the linear fit power law constants as described in eq. (2) of the aforementioned reference and whose default values are taken from Fig. 3, where they were reported for I(q) vs. q data limited to q = 0.3 Å-1. The third field contains the actual qmax cut-off value to which the available I(q) vs. q data will be limited (default: 0.2 Å-1). The constants default values are for globular proteins, and the cut-off value was found empirically to provide better results. If any of these values is changed, a warning will pop-up:
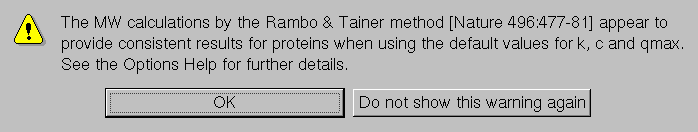
If the values are not reverted to the default values, this pop-up will keep showing up during the current US-SOMO session every time a molecular weight calculation with the Rambo-Tainer approach is performed, unless the Do not show this warning again button is pressed, avoiding the nuisance when using different values for different kind of biomacromolecules (e.g., RNA) or for testing purposes.
This document is part of the UltraScan Software Documentation
distribution.
Copyright © notice.
The latest version of this document can always be found at:
Last modified on June 26, 2024