
| |
Manual |
This portion of the manual describes the utilization of the original linear baseline subtraction tool (see Brookes et al. J. Appl. Cryst. 46:1823-1833, 2013). This tool should be now utilized only if there is just a minor drift between the initial and final baseline portions in the I(t) vs. t chromatograms, likely not due to capillary fouling but to other resaons such as incomplete column buffer equilibration. Starting from the May 2016 release, we have implemented a tool assessing the amount of drift and suggesting which kind of baseline subtraction would be more appropriate.
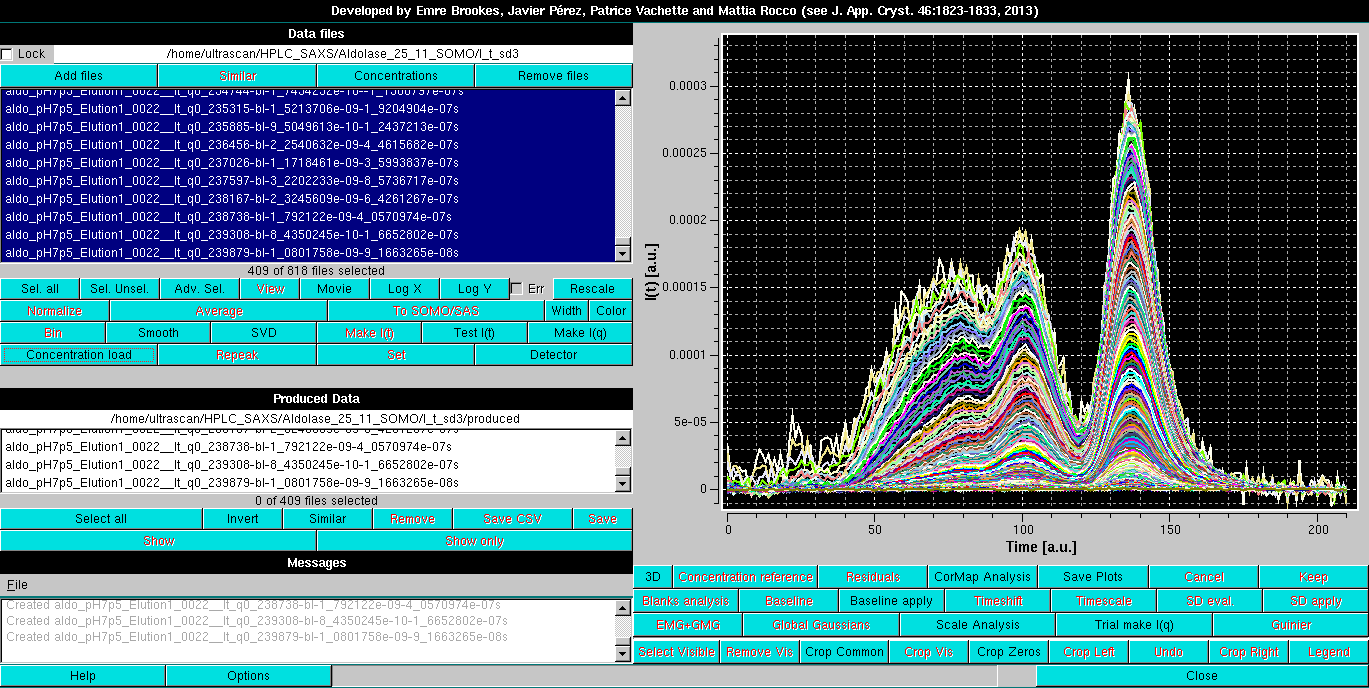
As an example, we utilize here a SEC-SAXS dataset collected on an Aldolase sample, which, in addition of multiple, non-resolved peaks that will be the subject of Gaussian decomposition with distorted Gaussian functions (see here), shows only a minor baseline drift:
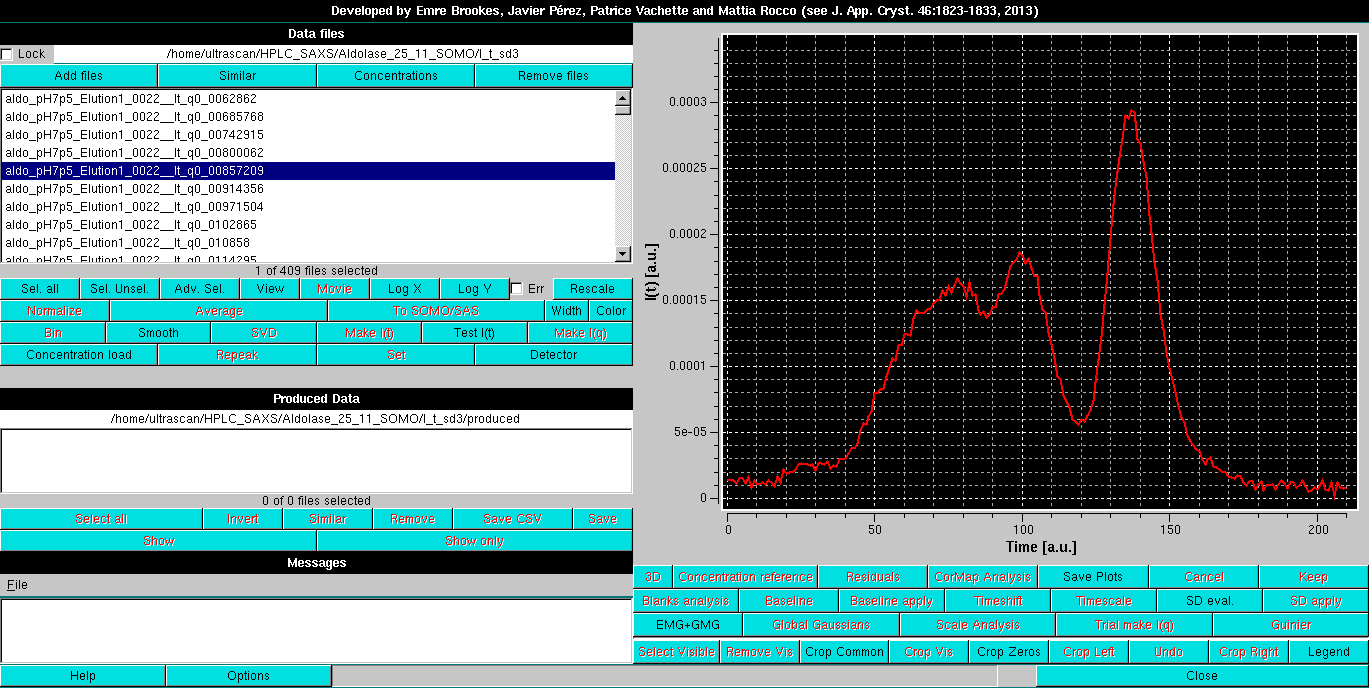
Contrary to what is required for the new Integral Baseline method, a single chromatogram is first selected; a compromise between high intensity and low noise works best.
In the Options module, select the Linear baseline removal checkbox. The Baseline button is then pressed. A pop-up message will appear:
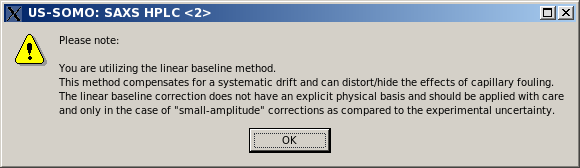
Pressing "OK" will allow to proceed. As shown in the image below, this superimposes to the selected chromatogram six vertical lines, three for each side. The two magenta lines on each side define the beginning and end, respectively, of the chromatogram regions over which the data are averaged to set the beginning and end of a baseline. The red lines define instead the beginning and end points of the data to be subjected to the baseline correction. The positions of the six lines are shown in the six fields in the bottom row, with their backgrounds color-coded accordingly. If the zero base checkbox is selected, the left-side lines and they respective fields will be removed, as it happens for the integral baseline operation (default: not selected).
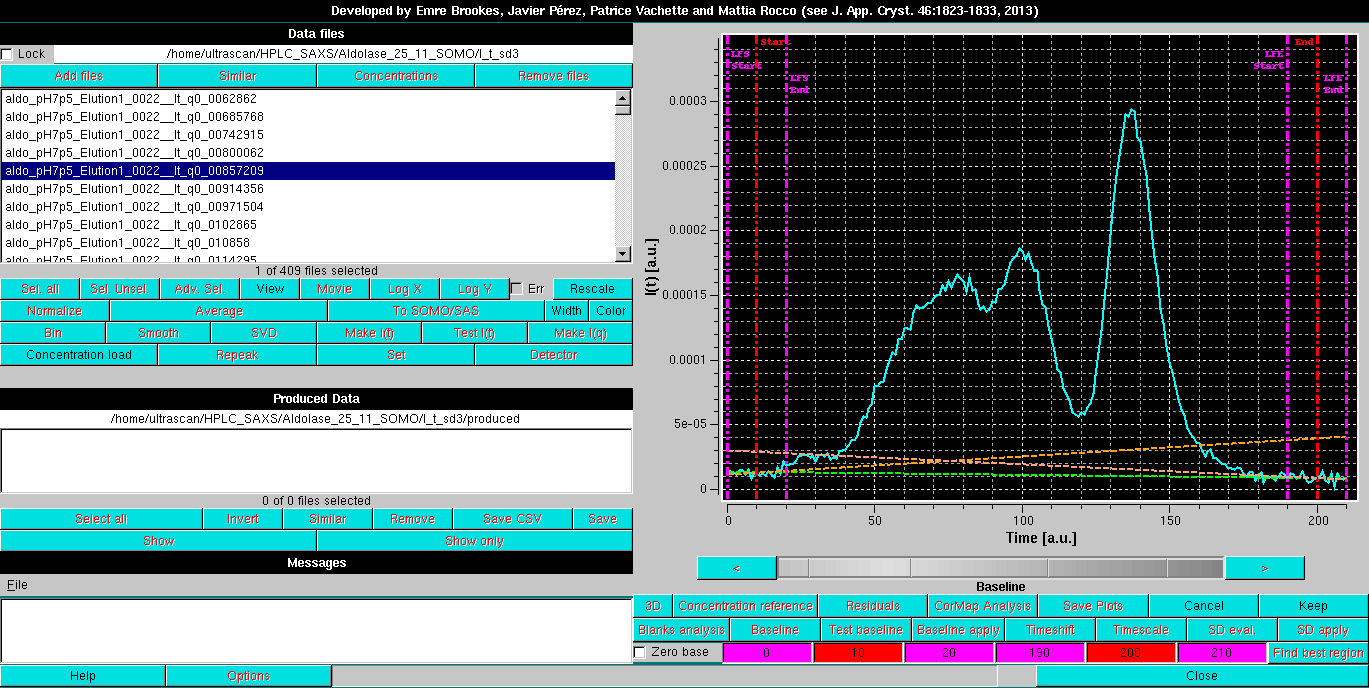
By clicking on each field, the corresponding line can be moved across the chromatogram using the gray-shades bar-wheel at the top of this panel or the "<" and ">" buttons placed at its sides. The actual baseline is shown as a green dashed line, while the two orange dashed lines show the trends of linear regression done on the regions delimited by the two couples of vertical magenta lines. Ideally, the orange lines should come as close as possible to the green line:

Pressing Keep once a reasonable baseline has been found will keep its parameters (initial and end points, slope) for further operations.
Cancel will remove the settings and revert to no baseline.
After pressing Keep, it is best to then select one by one a few other chromatograms and press Baseline again to see how the chosen settings perform for other datasets. If necessary, the settings can be modified and replace the initial ones.
The Baseline apply button becomes available once a baseline has been defined even a single I(t) vs. t chromatograms is selected. Pressing it will allow to compare how the chosen settings perform:
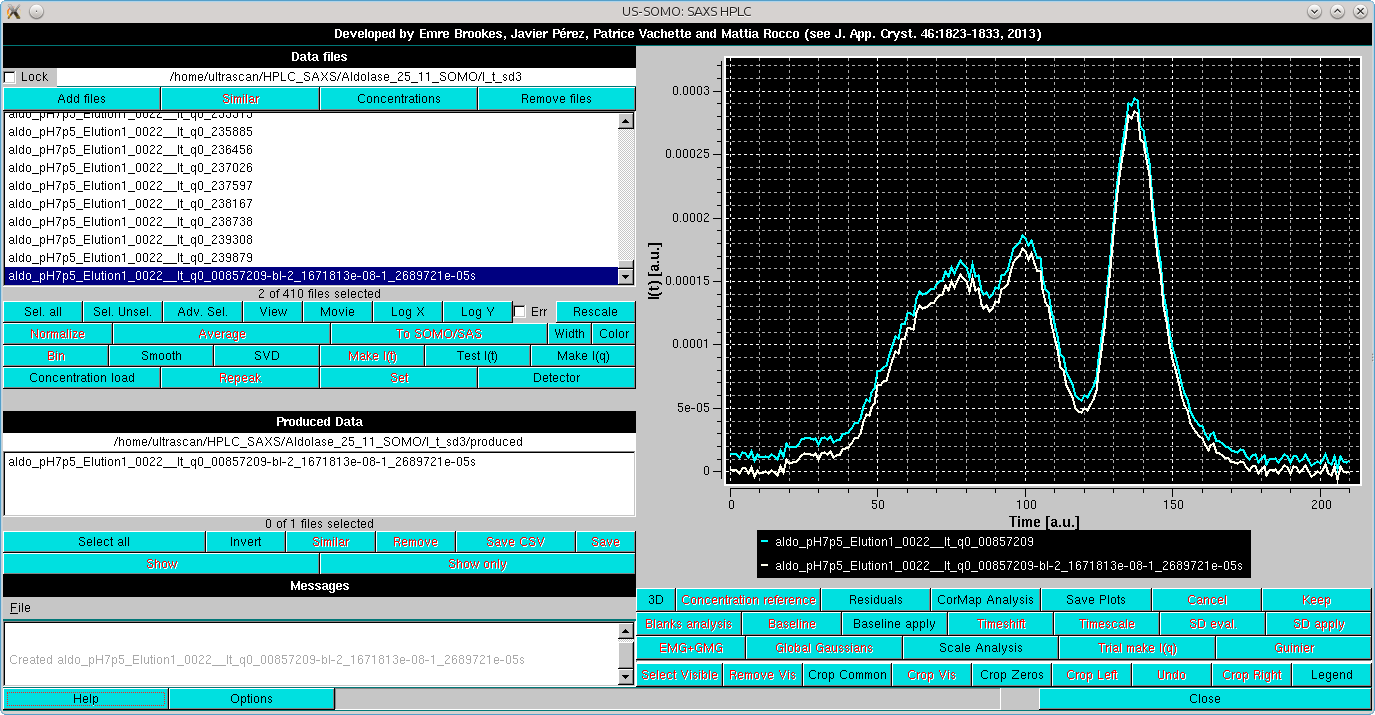
The baseline parameters thus set can be applied to all curves with concurrent subtraction of each baseline by selecting them all and then pressing again the Baseline apply button. A new set of data is generated, the initial and final points used in the linear baseline subtraction are added to the filename of the produced files, and two labels are added, "-bl" (=baseline linear) after the q value, ans "-s" at the end of the filename, as shown in the Data files panel:
The Linear Baseline-subtracted data can then be saved and further processed as described for the Integral Baseline-subtracted data.
This document is part of the UltraScan Software Documentation
distribution.
Copyright © notice.
The latest version of this document can always be found at:
Last modified on July 1, 2024.